Bell Riose
December 02, 2024 · 7 min read
QR code analytics: understanding your scan data
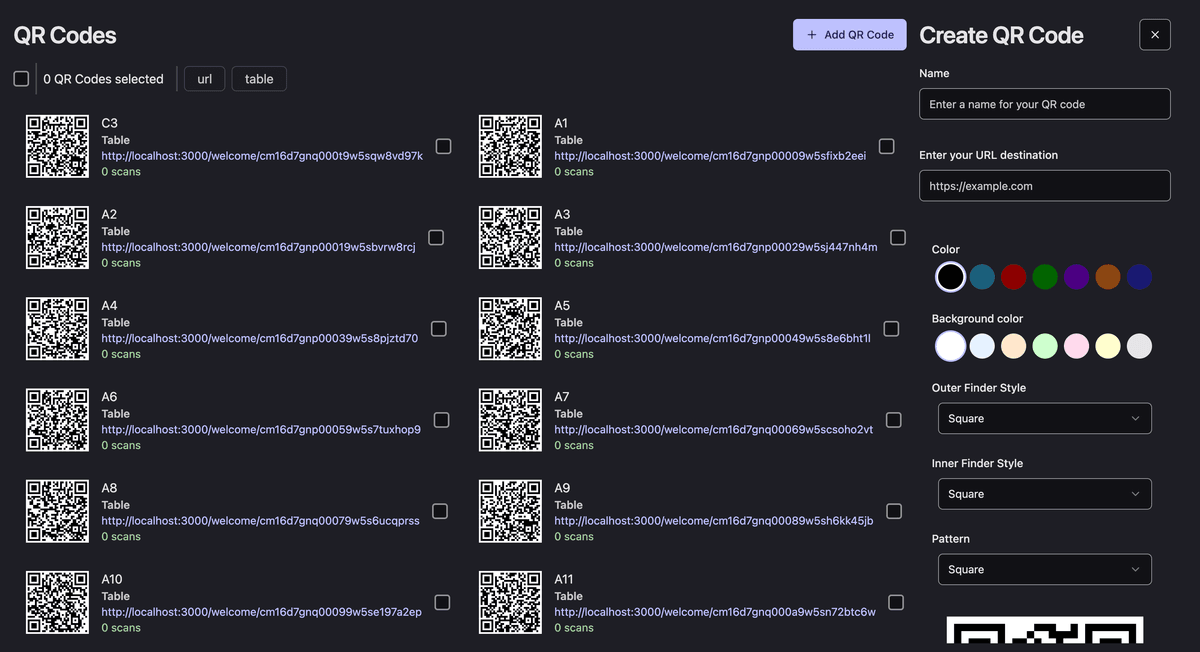
A Pipao QR code records four signals every time someone scans it: scan count, location, device, and timing. Read together, those four dimensions tell you how many people engaged, roughly where they were, what they used, and when — the feedback you need to decide what's working and what to change next.
Most QR tools either hand you an image with no tracking at all, or bury a vanity number behind a paywall. Pipao does the opposite: analytics are built into every dynamic code from the first scan, and the dimensions are honest and concrete — no inflated dashboards, just the four things that actually help you decide.
What does Pipao track for each scan?
Pipao records four dimensions on every scan of a dynamic code: how many times it was scanned, roughly where, on what kind of device, and when. That's the complete list — and that's deliberate. Four clear signals you can act on beat a dashboard full of metrics you can't.
Here's what each one is and the decision it informs.
| Signal | What it tells you | The decision it informs |
|---|---|---|
| Scan count | How many times the code was scanned | Whether the placement is getting attention at all |
| Location | Roughly where each scan happened | Which venue, city, or placement to double down on |
| Device | The kind of device that scanned it | Whether the destination is built for who's landing on it |
| Timing | When each scan occurred | When to publish updates and run promotions |
Scan count
Scan count is the headline: the number of times your code was scanned. On its own it answers one question — is anyone engaging at all? A code with steady scans is earning its placement. A code stuck near zero is telling you the placement, the offer, or the visibility needs to change. Treat count as the starting point, then break it down by the other three signals to learn why it looks the way it does.
Location
Location shows you roughly where each scan happened, which tells you which placements pull their weight. If one venue, neighborhood, or city drives most of your scans, that's where to concentrate — more codes, better positioning, or a sharper offer. If a placement you expected to perform is quiet, you've found something to fix before you spend more on it. For venues running codes across several tables or sites, location is how you compare them fairly.
Device
Device tells you the kind of device people scanned with — broadly, mobile versus desktop. It's a quick gut-check on the page behind your code. QR scans skew heavily to phones, so if your destination isn't comfortable on a small screen, the device split is the early warning. Make sure the page your code points to looks right for the people actually landing on it. (For how the code itself should look so it scans cleanly in the first place, see designing QR codes that people actually scan.)
Timing
Timing reveals when people scan, and timing reveals intent. A flyer scanned mostly at lunch is doing a different job than one scanned late at night. Find your peaks, then schedule around them: publish a new menu before the rush, launch a promotion when attention is highest, and avoid changing the destination mid-peak. Timing turns your code from a static asset into something you can manage on a schedule.
How do you read scan data?
Read the four signals together, as trends over time — not as four separate totals. The fastest way to get value is to ask one question per signal and let the answers point to a single change you can make this week.
Set a goal
Decide what a "good" scan looks like — a signup, a menu view, a download, an order. Without a goal, every number is just a number. With one, each signal has something to be measured against.
Watch the trend
For the first two weeks, check scans by day to find your timing peaks, and by location to see which placements pull their weight. Note the device mix so you know the destination fits the audience. You're looking for the shape, not the single highest number.
- 3
Adjust the destination
Because the code is dynamic, you can change where it points at any time — no reprinting required. Send scans somewhere better, fix a weak page, or swap in a fresh offer, and every printed copy follows along on the next scan.
That third step is the payoff most QR tools can't offer. With a static code, reading your data and wanting to change something means a new design, a new print run, and re-shipping. With a Pipao dynamic code, the destination lives in the cloud, so the analytics and the fix happen in the same place. (If you're still deciding between the two, static vs dynamic QR codes breaks it down.)
How do you turn scan data into action?
Turn data into action by changing one thing at a time and watching the trend respond. Analytics aren't a report you file — they're a loop. Read, change the destination, read again. Here's how each signal becomes a concrete move.
- Scan count flat? The problem is upstream of the destination. Reposition the code, make it bigger, or give people a clearer reason to scan before you touch the page it points to.
- One location dominating? Concentrate there. Print and ship more codes to the winning placement instead of spreading effort thin across quiet ones.
- Mostly mobile scans, weak engagement? The destination likely isn't mobile-friendly. Point the code at a cleaner, phone-first page — no reprint needed.
- Clear timing peaks? Schedule your updates around them. Publish menus and promotions just before the rush so the freshest content meets the most attention.
This A/B-by-placement trick is the cleanest experiment you can run with QR codes, and it works precisely because the codes are dynamic and tracked. Same destination, two codes, two locations — the scan counts settle the debate. Then point the winner wherever you want and retire the loser, all without ordering anything new.
Who uses scan analytics, and for what?
The same four signals serve two very different jobs.
Event and individual creators — DJs, photographers, planners, and anyone running a one-off campaign — use scan count and timing to see whether a flyer, poster, or social post actually landed, and adjust the destination on the fly if the link or page changes before the gig. You can start free and buy a printed code as a one-time purchase, with no subscription, and it still tracks every scan. (Five creative ways to use dynamic QR codes has ideas worth measuring.)
Food and drink venues — cafés, fast food and ice cream shops, restaurants, and shisha lounges — read location and timing across their printed table codes to learn which tables and which hours drive activity, then publish menu and promotion changes around the peaks. With Premium ($9.99/mo), those table codes plug into a full table-ordering system — menus with categories, products, and promotions, per-table codes, and live order tracking — so the scan data sits right next to the orders it drives.
Frequently asked questions
What does Pipao track for each QR code scan?
Four signals: scan count (how many times the code was scanned), location (roughly where each scan happened), device (the kind of device that scanned it, such as mobile or desktop), and timing (when each scan occurred). Those four dimensions are recorded in real time for every dynamic code, with no setup required.
Do I need to set anything up to get scan analytics?
No. Scan analytics are built into every Pipao dynamic QR code automatically. As soon as a code starts getting scanned, the count, location, device, and timing are recorded — there's no tag to install, no pixel to add, and nothing to configure. You start free and the data appears in your dashboard.
How do I read my scan data in Pipao?
Start with the trend, not the total. Look at scans over time to find your peaks, split by location to see which placements pull their weight, and check the device mix to confirm the destination is built for who's actually landing on it. Read the four signals together — one number on its own rarely tells the story.
Can I A/B test two QR code placements?
Yes. Create two dynamic codes that point to the same page, print one for each placement, and compare their scan counts. Because both go to the identical destination, the difference in scans reflects the placement itself — which poster, table, or location earns more attention.
How does dynamic editing connect to analytics?
A Pipao dynamic code lets you change its destination anytime without reprinting. That closes the feedback loop: you read the scan data, learn what's working, then point the same printed code somewhere better — no new print run, no reordering. The analytics tell you what to change, and the dynamic code lets you change it.
Do scan analytics work on a printed code that's already shipped?
Yes. The four signals are tied to the code's redirect, not to where it's displayed. So a code Pipao printed and shipped to your door keeps recording count, location, device, and timing on every scan, and you can still edit its destination at any time.
Your codes are already counting. Open your analytics in Pipao, find one signal worth acting on, and change the destination — no reprint required.